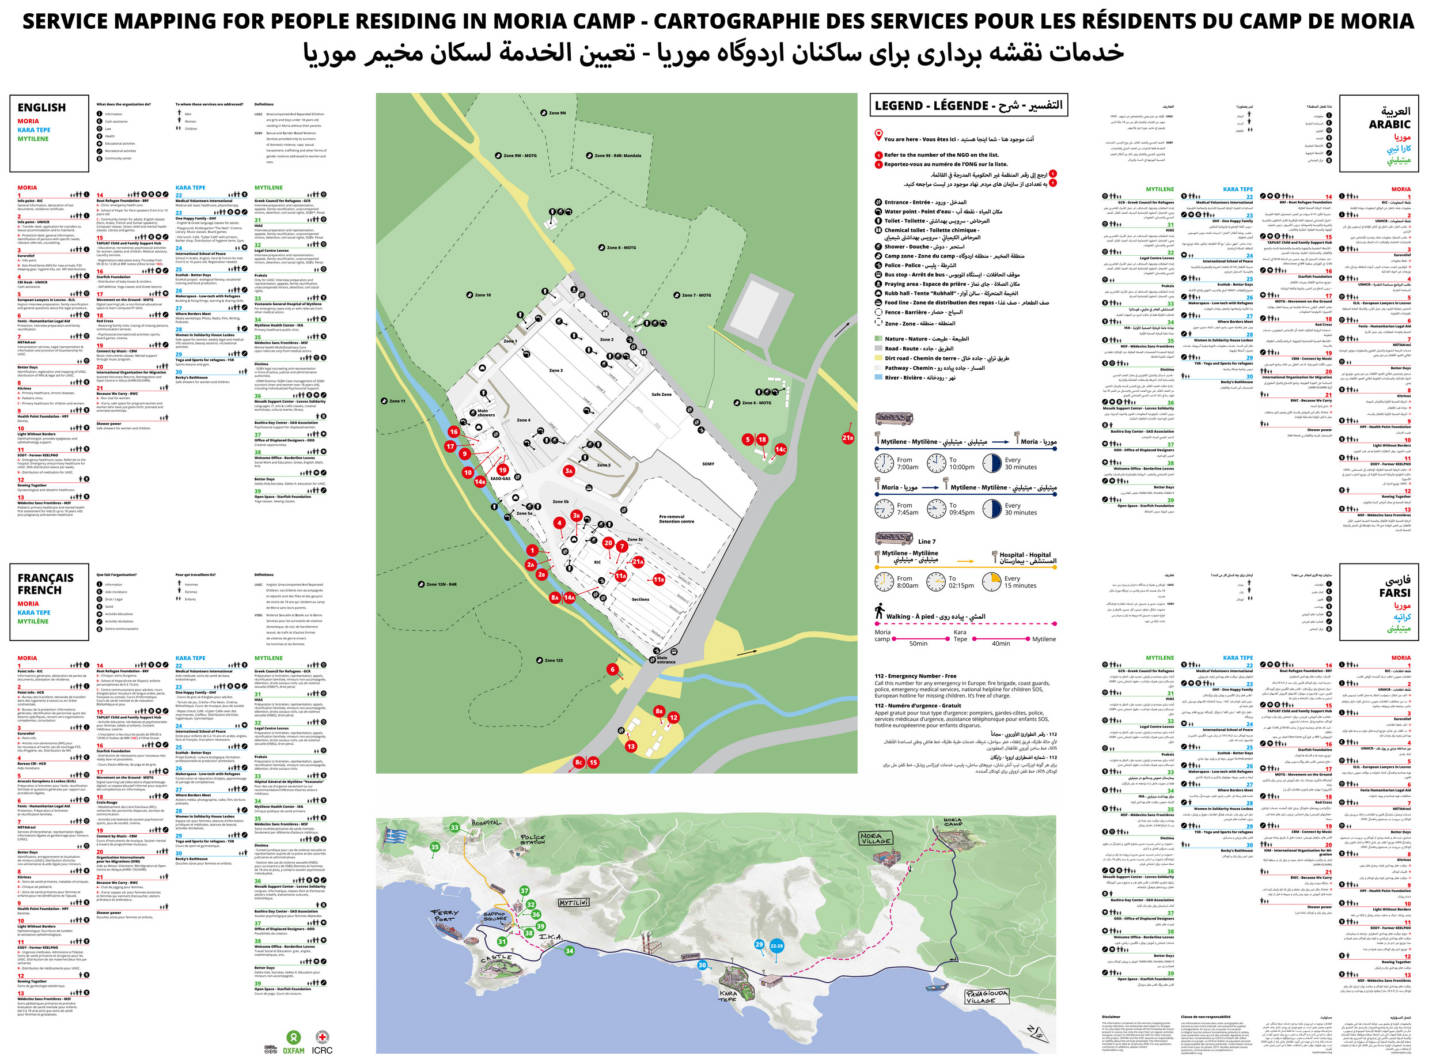
Service mapping for the residents of Moria camp
Description: A 3W map (Who, What, Where?) made in collaboration with the residents of Moria camp.
Company: Oxfam, International Committee of the Red Cross (ICRC), Where Borders Meet
Job title: Design consultant
Location: Lesvos island, Greece
Year: 01.10.2019 – 01.02.2020
SDGs: Target 16.10
Context
After launching the 3W map of NGOs and services of Lesvos in 2018, I received a lot of positive feedback from the different NGOs. This project helped me to build stronger relationships with actors and gain people’s trust about my design and networking skills. Therefore, actors often came to me to get information about NGOs; and to ask for advices on information design’s projects.
What problem did I solve?
In 2019, Oxfam came to me to work on a service mapping for the residents of Moria camp. I wrote a proposal and we agreed on the framing of the project:
- The map should be done with the residents to avoid cultural biases and select the relevant needed information. Workshops would be organised with creatives from different communities, and they would be paid for their work.
- The map should be translated in the four main languages.
- The printed maps should be showcased in and out of Moria camp. The maps should be updated every three months to not become useless. A budget should be allocated to the editing and printing.
- Not all the NGOs and services would be shown on the map.
- The map should be made by creatives from the camp, if possible.
The lack of information was a real issue shared by community leaders to Oxfam. Often people would ask where to find the different services. They would walk sometimes hours to meet a closed door or a service that can’t answer their needs. Volunteers would sometimes unknowingly share outdated information, creating more confusion.
How did I solve it?
Who is doing what?
Oxfam did the field work:
- They contacted NGOs to get their updates & approvals to be shown on the map.
- They worked with local authorities to get the different approvals to showcase this information within and around the camp.
- They worked with translators to get the different versions of the text.
- They found creatives from the camp to participate in the workshops.
ICRC was on the loop and helped Oxfam to get NGOs’ approvals. In March 2020, Oxfam left Lesvos. ICRC took over the service mapping project and allocated a budget to it.
Where Borders Meet helped to provide a space for the workshops and had a graphic designer from the camp to create the final version.
As a client, Oxfam handled the information so I could focus on the workshops and the design of the map. But facing some delay to obtain the approvals and start the workshops, my deadline arrived and I had to leave Lesvos.
All these challenges are part of Lesvos and we know how to work around. I created the workshop program and coordinated closely with the coordinator of Where Borders Meet who leaded the workshops.

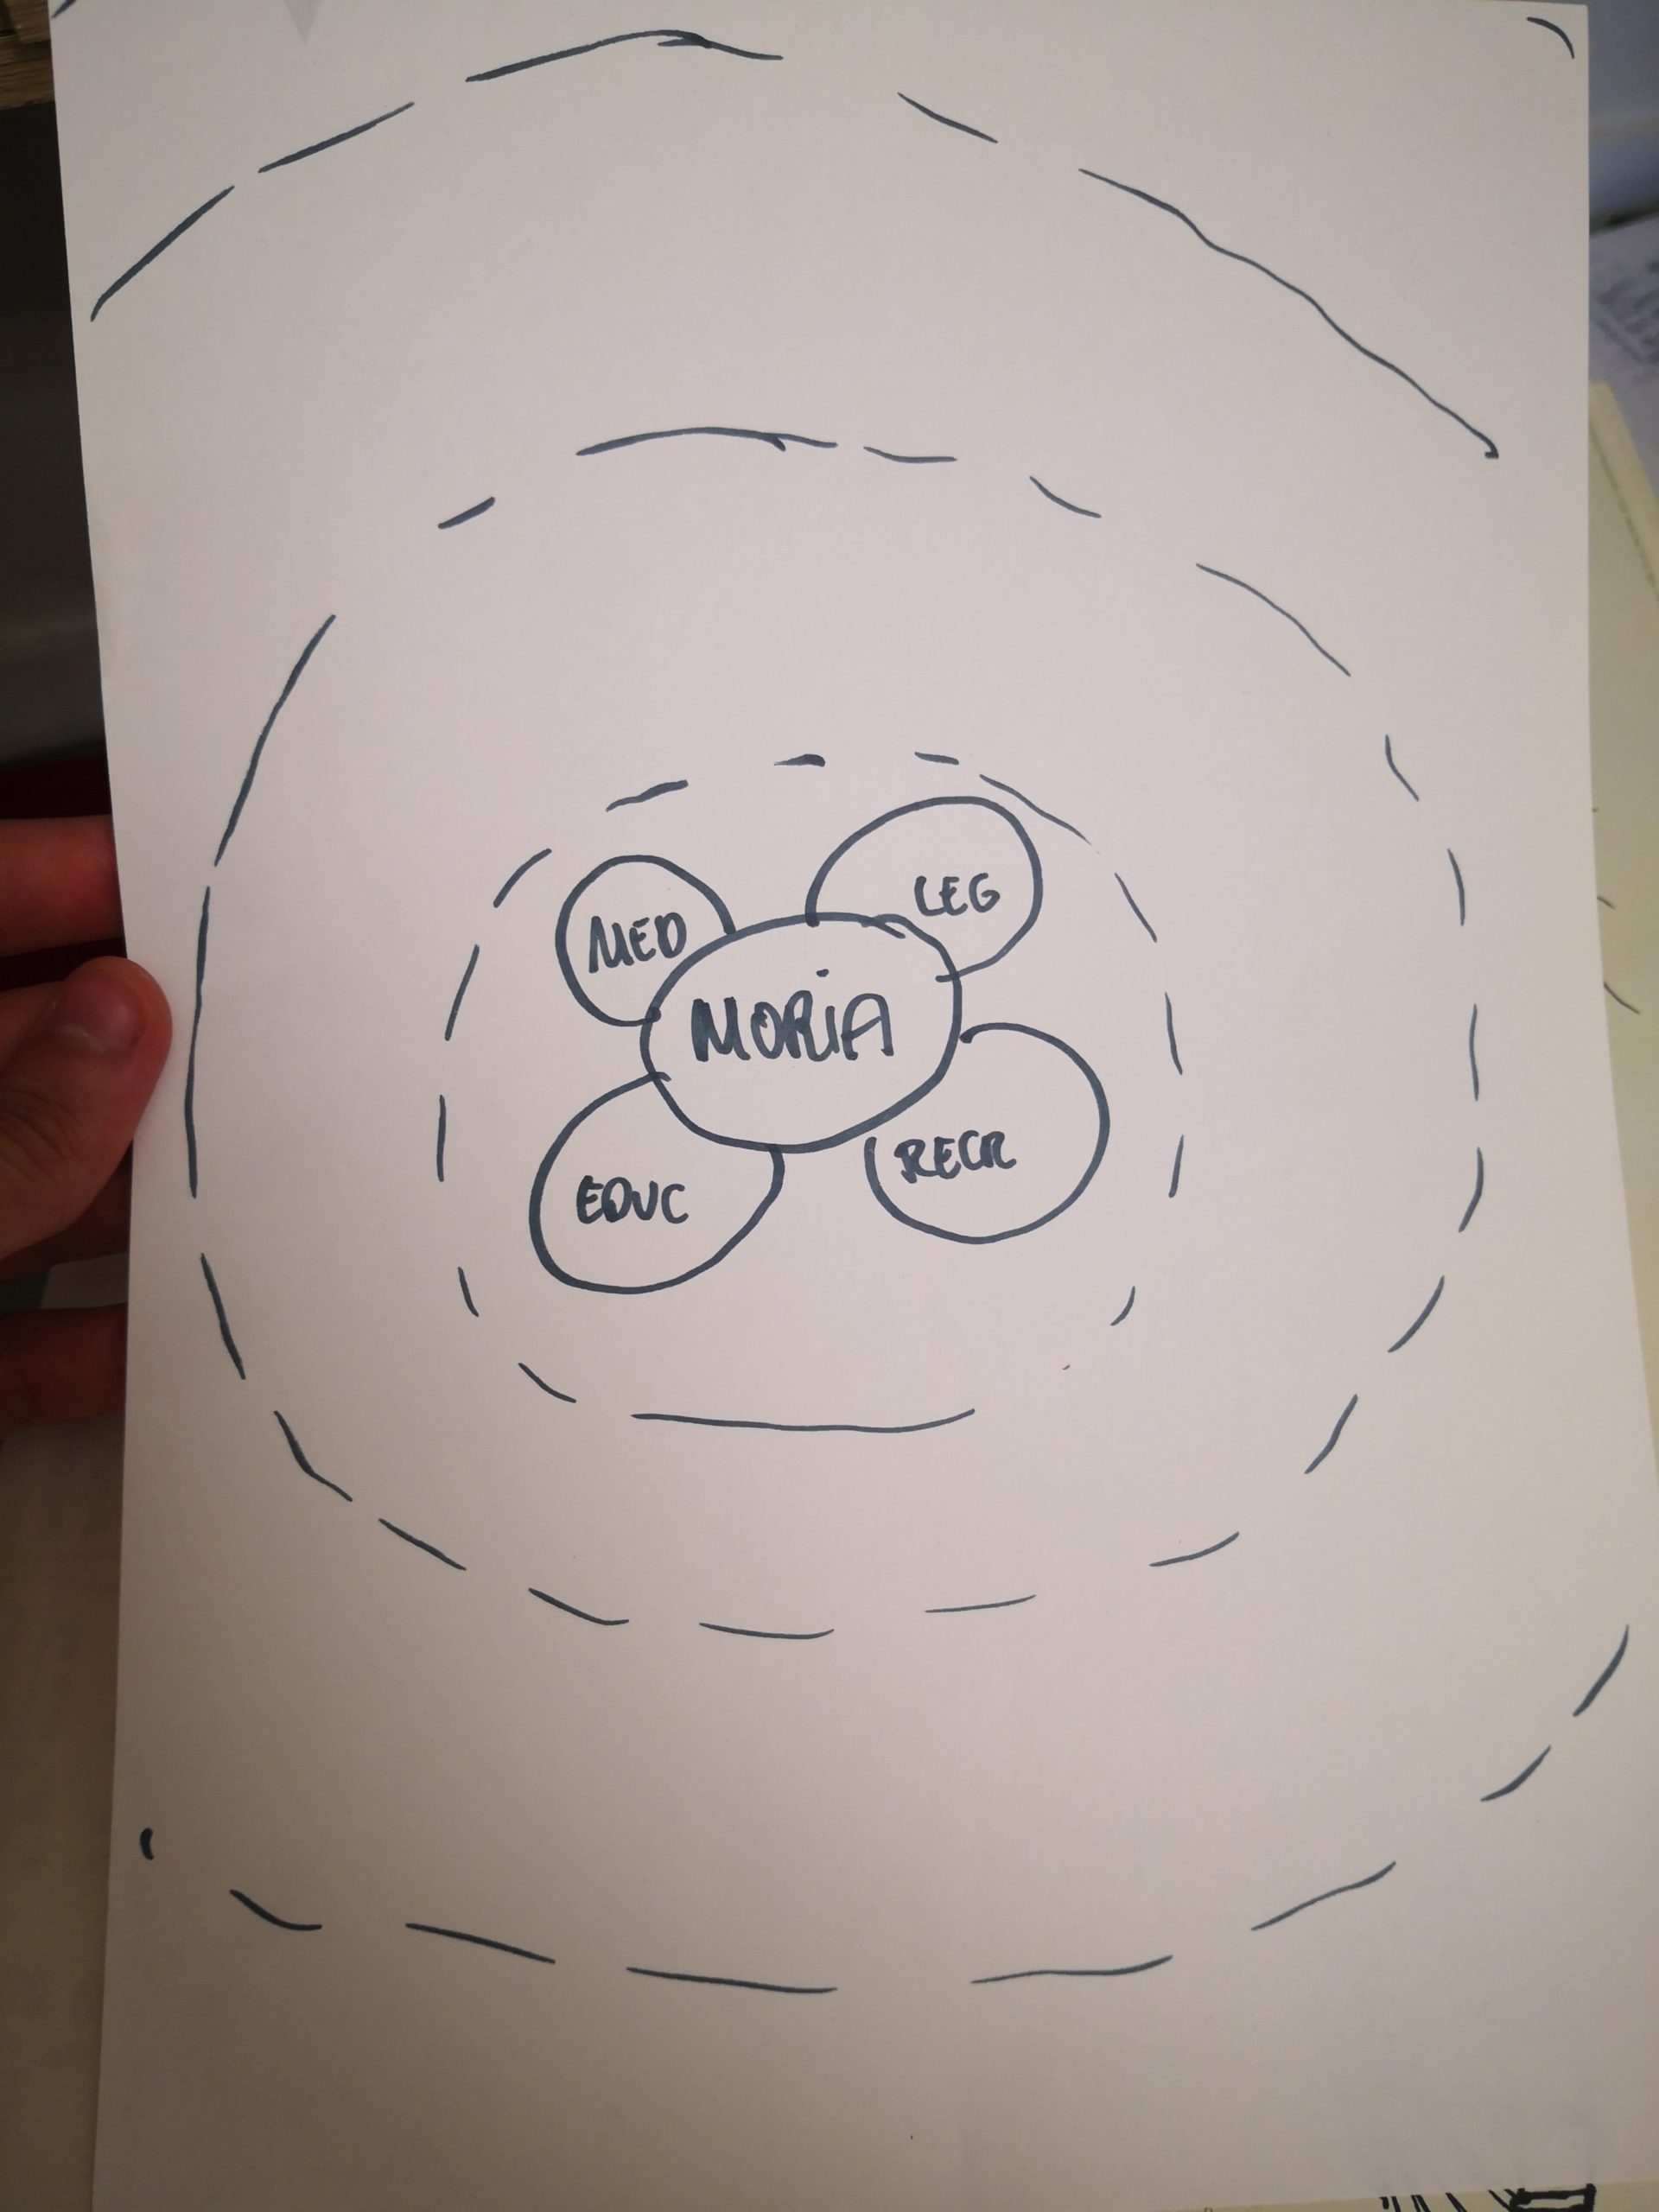
Workshops: phase 1 – Understand the needs
I started to search for existing informational maps. We showed the images to the creatives to get their feedback and start a creative conversation. What do they like or not? Which information seems relevant or not? What do they think about colours? …
- We quickly got the insight that “only text” would not be attractive and not motivate people to read. There must be a map view to attract the eye.
- The map view should be realist. If it looks like a “metro map”, people won’t understand.
- Colors can help to pay attention and understand a map.
- 3D satellite view with buildings is good. The distance helps to understand but it’s too chaotic.
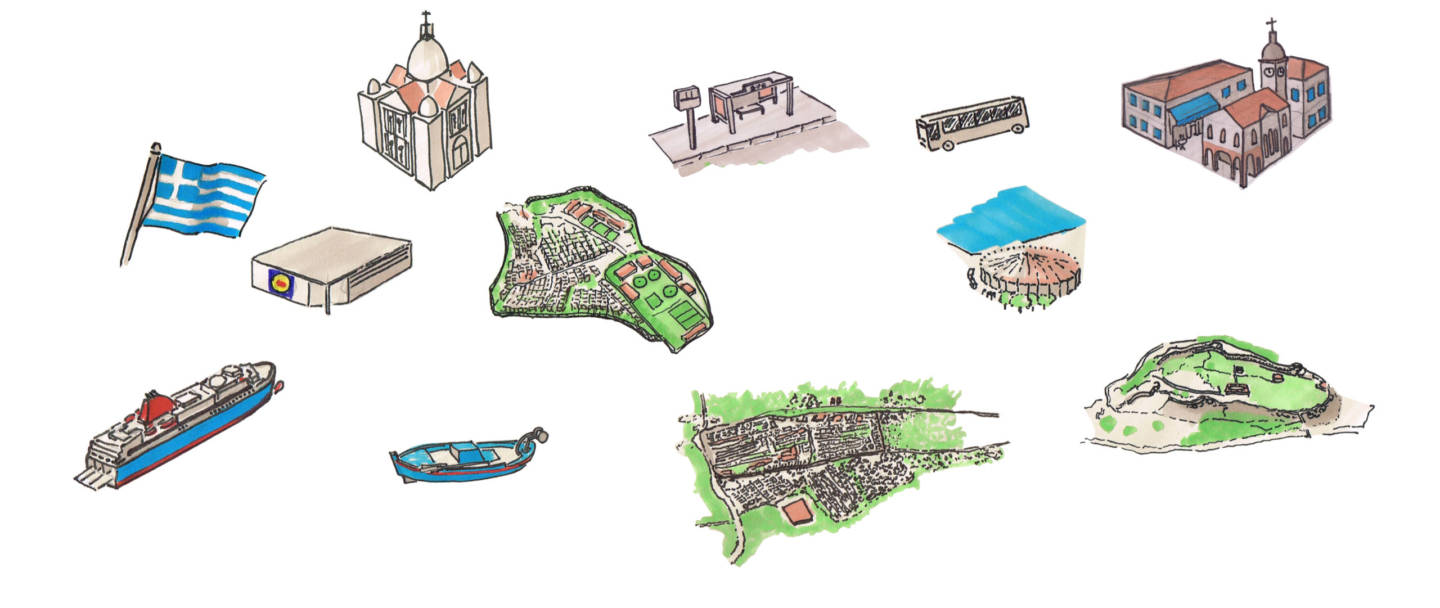
- It’s important to add bus stops and some landmarks such as Lidl, Kara Tepe, Public shop.
- They do understand the set of pictograms from UNOCHA.
- It should be visual enough for everybody (illiterate, young, old, other languages) to understand the content.

Workshops: phase 2 – Start with drafts
After having everybody understanding the needs, we shared what are the informations we need or should have:
- A map of Moria camp.
- A map of Lesvos.
- NGOs name, description, category, targeted population and exact location.
- Bus schedules.
- Legend.
- Emergency numbers.
- Logos and footnotes.
- Everything translated into four languages.
- A fair representation of ethnicities on the illustrations (or not at all).
We didn’t focus yet on the feasibility. We didn’t have the list of NGOs yet. It was more a workshop to learn, work and experiment with layouts. I insisted to not use any digital devices to not loose time on details.
The idea of having multiple workshops was also for the creatives to take their work back home, show it to their own communities to gather more feedback and improve the iterative process.


Phase 3 – The creation of the map
At that time, the graphic designer from Where Borders Meet had been transferred to Athens. It is important for information design to be consistent and made by one person.
The complex situation being, it would have been too long to find someone else, explain the project from scratch and maybe see this person leaving again. So, we decided that I would take over the creation of the poster. It was a practical decision that was always kept as an alternative from the beginning.
Receiving all the information, I quickly realised how difficult it would be to fit everything. I had to adapt the layout while keeping the general idea decided during the workshops. There was 46 NGOs: many had exceptions to take care of, and sudden updates to correct before printing.
With my experience in working on Information design, the collaboration and process went smooth.
- I am used to handle the tricky right-to-left alphabets on the “Occidental software” Indesign so I quickly arrived to a final version.
- I received different maps from Moria camp. I was able to create a new version that was the most detailed and updated version of Moria camp made publicly available.
- I drew the map of Lesvos and the different landmarks.
- I proposed different formats because the locations to hang the posters were not defined yet. After long discussions, including the print shop, we chose the A0 version on vinyl fabric that was allowing us to have a much larger map of the camp, instead of five A2.
- I also introduced the idea of Creative Commons. ICRC, who took over, agreed to make this map public, shareable and reusable.
What was the impact?
The project was finished in February, few weeks before the pandemic.
The pandemic completely changed the context on Lesvos:
- Volunteers had to leave back home and no travellers were allowed on the islands. It disrupted a lot of grassroots NGOs, dependent of these volunteers.
- Moria camp was put on lock down by the government. Residents were not allowed to leave the camp, and NGOs were allowed inside.
Therefore, it was decided that we would wait the end of this yet unknown long pandemic to update and print the posters. Indeed, wrong information is more harmful than no information.
The government used the excuse of the pandemic to forbid residents to leave the camp during the whole summer, while tourists could come and go on the island.
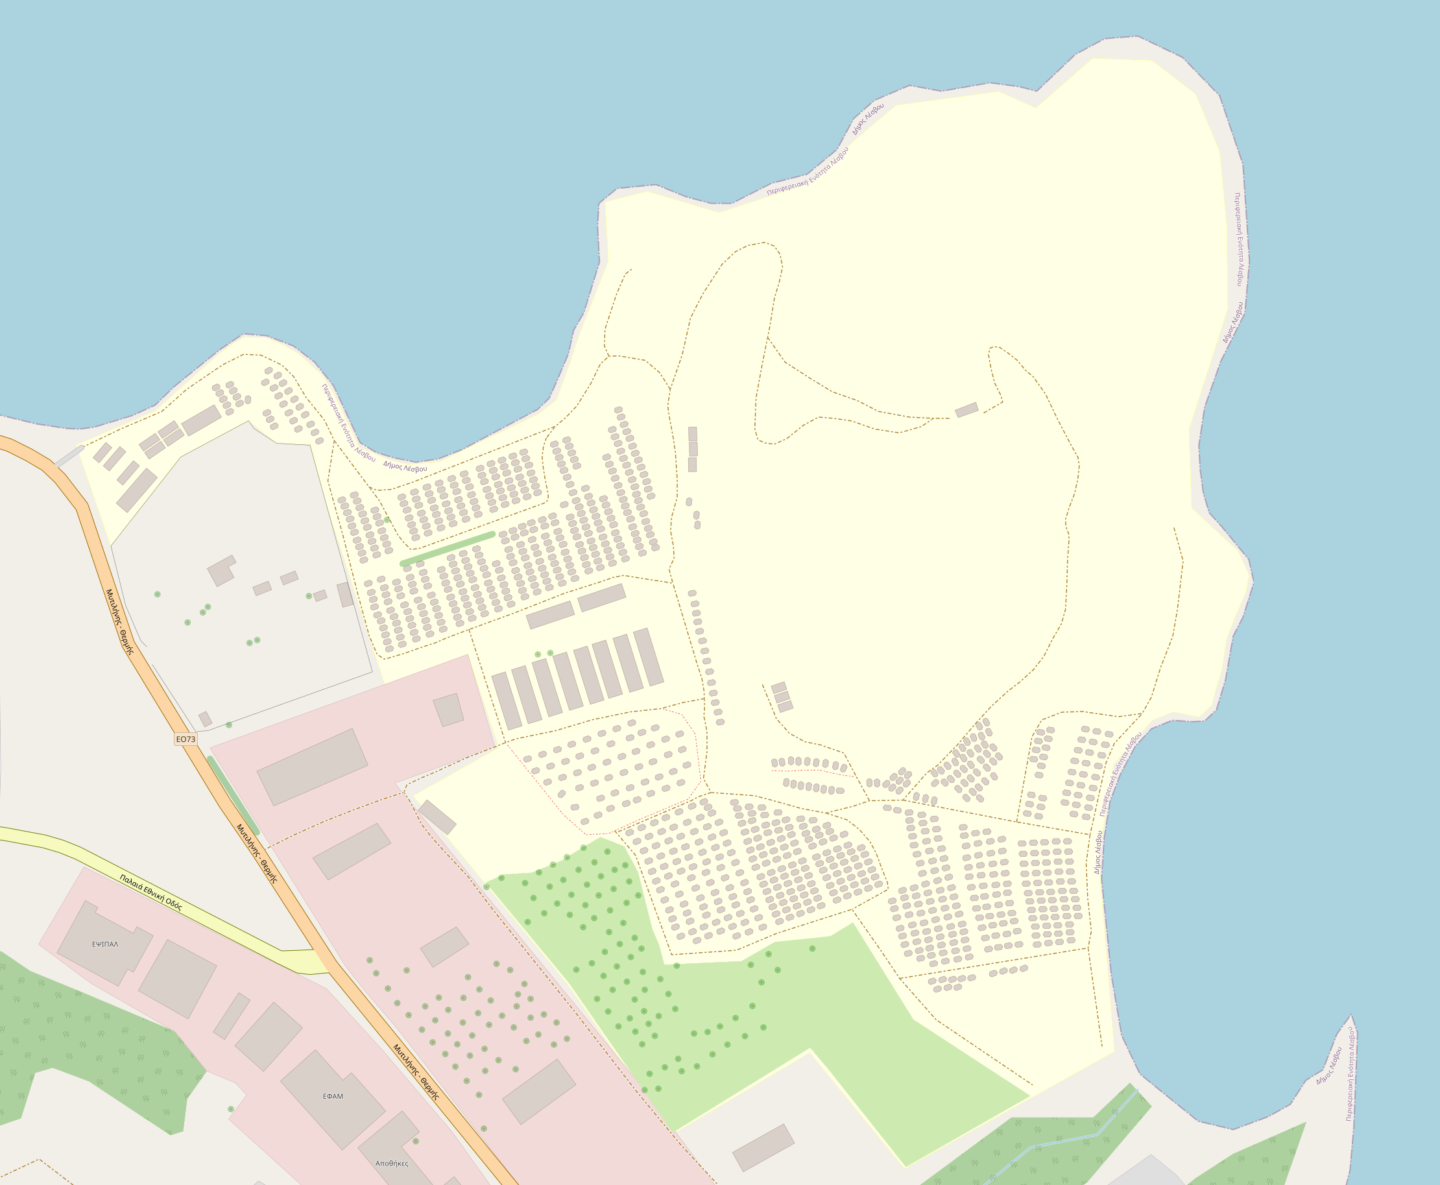
On 9th of September 2020, Moria camp completely burnt down, putting the 13.000 people locked down onto the street. After a week, they were transferred to a new location that is unfit to welcome so many people.
In order to raise awareness about these new conditions and help the NGOs from a distance, I worked on the open source OpenStreetMap and added the camp and all the new tents.
I also created an image to show the lack of improvement between the two camps and the lack of reactions from the EU and the Greek government:

And finally, if you want to get the A0 pdf of the service mapping: